While bar charts, line graphs and simple numbers are hardly capable of providing the defining answer to many economic, social and political questions, they are certainly a good way of obtaining a general overview of any particular subject.
Each month the Business Supplement will look into a brace of statistical information and provide readers with what we consider to be the central elements of these figures.
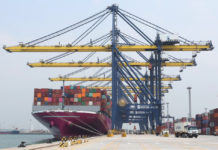
Most of the world’s top 20 busiest shipping ports are in Asia
Certainly some interesting facts emerge when it comes to looking at shipping ports across the world. They are of course the lifeblood of international trade with more than 90 per cent of all products in the world at some point having travelled by sea.
Shipping volumes are enormous and growing fast. One standard measurementis the TEU, which stands for “Twenty-foot or Equivalent Unit”, i.e.a standard shipping container. A 40-foot container, also ubiquitous these days, is equivalent to 2 TEUs.
Trade amongst the top 50 ports has increased nearly 8 per cent in the last 4 years with 5.86 million TEUs being shipped worldwide.
Yet it is data on the top 20 ports that make for some interesting reading. Only 3 are in Europe and only one is in the U.S. (Los Angeles). The rest are in Asia with China taking a commanding lead.
Top of the list is the port of Shanghai, which handled 37.1 million TEUs in 2016, a 14 per cent increase from 2012 numbers.
Singapore is second on the list with 30.9 Million TEU’s, but over the same period volumes have actually fallen very slightly by around 2 per cent.
China has 8 ports in the top 20 and 6 of these are in the top 10 including Shenzhen in 3rd place, Ningbo-Zhoushan in 4th place, Hong Kong in 6th place, Guangzhou harbour in 7th place and Qingdao in 8thposition.
Guangzhou and Ningbo-Zhoushan have seen a 28 per cent growth rate in the period with current volumes of 21.6 million and 18.9 million TEUs respectively. The highest growth rate (34%) was also in China at Xiamen port where 9.6 Million TEUs were handled.
Other ports in the top 20 in Asia (but not in China) include Port Klang in Malaysia, Busan in South Korea, Keihin in Japan, and Kaohsiung in Taiwan.
Inbound tourism numbers growing steadily in Asia
Tourism continues to grow in the Asia Pacific region with Thailand being just one of many countries enjoying a brisk uptick in tourist numbers.
In South East Asia, from 2013 to 2017, Thailand lead the way in terms of both visitor numbers and money spent in the country. Some 35.6 million people visited the Kingdom in 2017, up from 26.55 million 4 years earlier. Expenditure topped US$62.16 billion.
Second on the list was Malaysia with 25.83 million visitors spending US$18.35 billion.
Singapore was a close third in terms of visitor numbers with 19.23 million visitors in 2017, however their spending hit US$19.71 billion.
Indonesia saw more than twice the number of visitors than the Philippines did with the two countries receiving 14.04 million tourists and 7.13 million tourists respectively in 2017. In Indonesia they spent collectively US$10.3 billion whilst in the Philippines the total was US$8.35 billion, indicating the amount per head was higher.
In the next 5 years, Asia Pacific inbound tourist numbers are expected to rise by another 5.5 per cent, with Vietnam, Laos and Papua New Guinea seeing much higher rises of 14 percent, 12.3 per cent and 12.7 per cent respectively.


